Placerville California Live Weather Center
[ Serving Placerville Since 2006 ]
| Storm Prediction |
Bodega Bay Tides |
Fire Danger |
Air Quality |
|
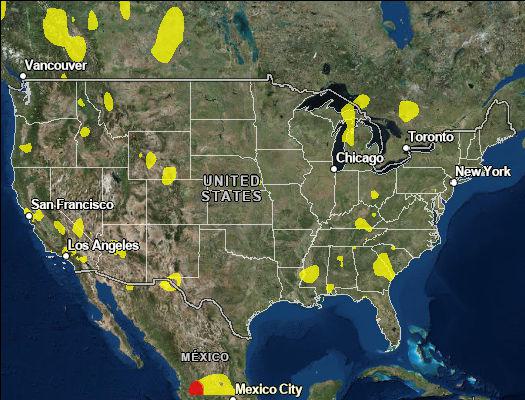
Current SPC Activity Chart
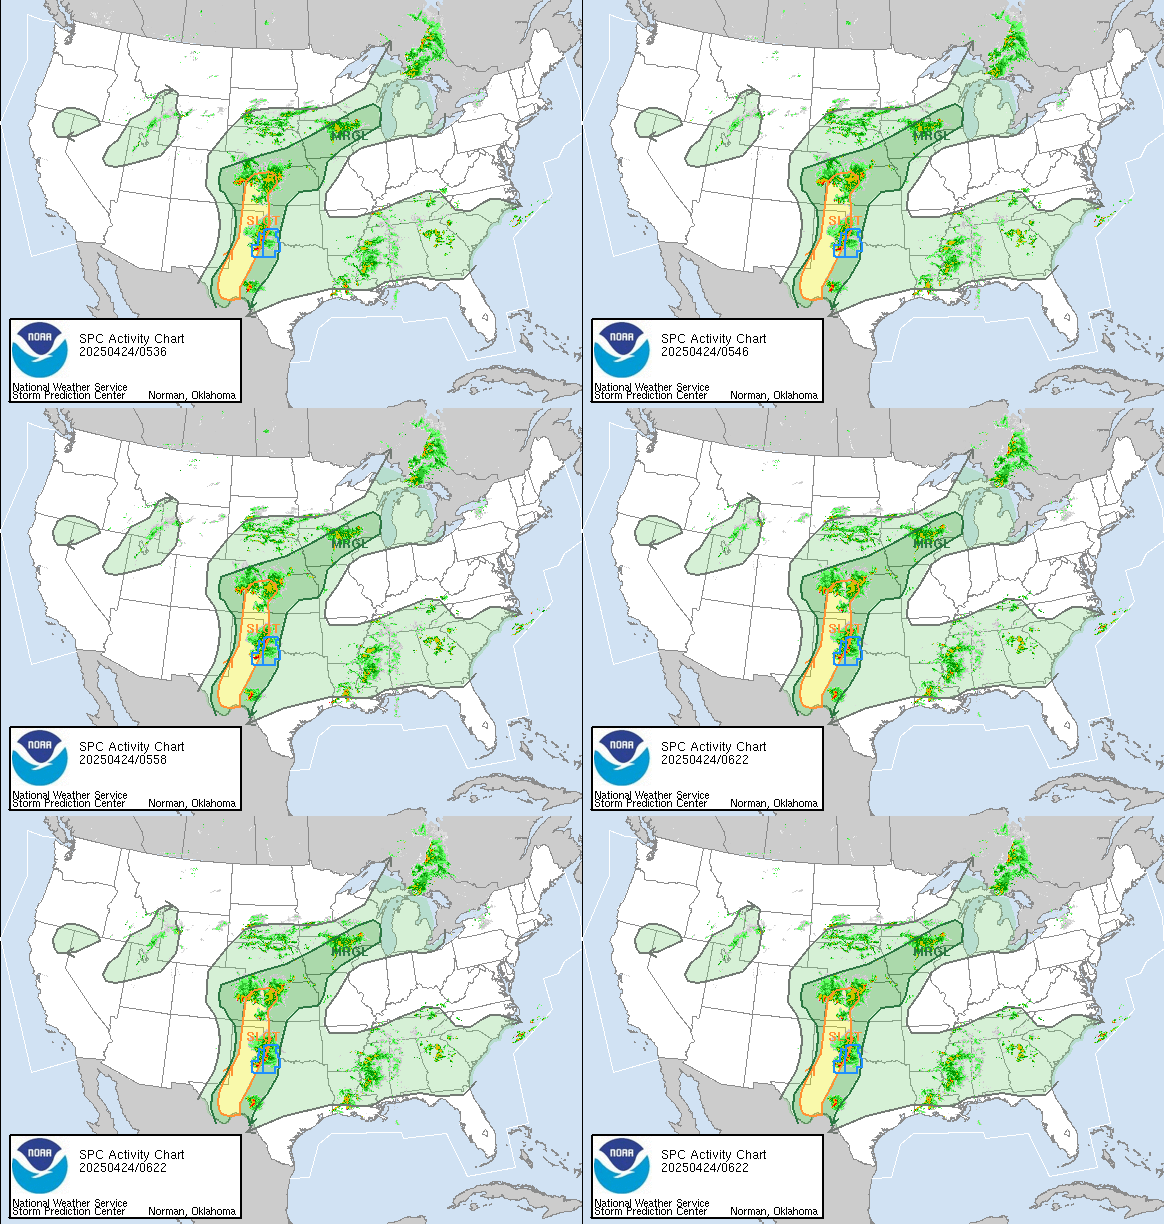
*SPC = Storm Prediction Center
|
|
1 hour, 37 minutes,
until high tide at:
07:14 AM PST |
|
|
|
|
Current Control Status:
ICN:1 | S3C2:5 |
ISS:Ok | CON:4.4 | RCP:98%
| Up: 5 Days 9 Hours 39 Minutes 49 Seconds |
| Live Active Weather Alerts for California
|
|
| Downtown Placerville 3-Day Forecast: Updated at 1:21 am PST Jan 28, 2026 |
Today

Mostly Sunny
Hi 59 °F | Mostly sunny, with a high near 59. Calm wind becoming northwest around 5 mph in the afternoon. |
Tonight

Mostly Clear
Lo 41 °F | Mostly clear, with a low around 41. Calm wind. |
Thursday

Sunny
Hi 62 °F | Sunny, with a high near 62. Calm wind. |
Thursday
Night

Partly Cloudy
Lo 44 °F | Partly cloudy, with a low around 44. Calm wind. |
Friday

Partly Sunny
Hi 65 °F | Partly sunny, with a high near 65. Calm wind. |
Friday
Night

Mostly Cloudy
Lo 46 °F | Mostly cloudy, with a low around 46. |
PLEASE NOTE: This forecast is for downtown Placerville, CA. & those near 1,850 ft. elevation. See "Live Panel Footnotes with Location & Forecast Info" on bottom of page for footnotes or click on a forecast location below.
|
| Downtown Placerville | Western Placerville | Eastern Placerville | Northern Placerville
|
|
U. S. Lower 48 High & Low Temperatures of the Day
National High and Low Temperature (for the contiguous United States)
NWS Weather Prediction Center, College Park, MD
Issued 7 am EST Wednesday, January 28, 2026

High Temperature for Tuesday, January 27, 2026
(as received by 7 am EST January 28)
79°F at 2 miles west of Pala, CA

Low Temperature for Wednesday, January 28, 2026
(as received by 7 am EST January 28)
-19°F at Whitefield, NH
|
Current Satellite Maps, Radar Maps & Misc Weather Maps
Main Weather Map Directories
Solar/Twilight Rising & Setting Times for Placerville, CA.
| Key |
Sunrise/Sunset |
Civil Twilight |
Nautical Twilight |
Astronomical Twilight |
| Sunrise: |
7:12 am |
6:42 am |
6:10 am |
5:39 am |
| Sunset: |
5:20 pm |
5:50 pm |
6:22 pm |
6:53 pm |
| |
| Moonrise: 12:47 pm on 01/28/26 | Moonset: 3:30 am on 01/28/26 | Illiminated: 76% |
|
|
1st Quarter: 1/26/2026 | Full: 2/01/2026 | Last Quarter: 2/9/2026 | New: 2/17/2026
|
Sun & Moon Track & Position in the Sky
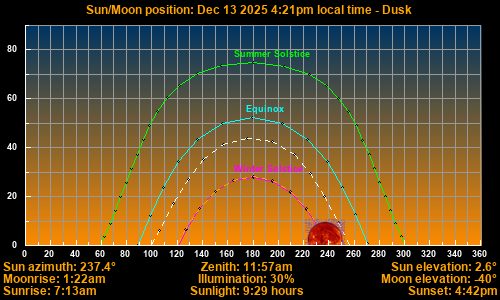
♠ Noon is technically when the Sun is at Zenith.
♠ Morning civil twilight is when the sun is between -6° and 0° below the horizon and ends at sunrise.
♠ Morning Nautical twilight is when the sun is between -12° and -6° below the horizon.
♠ Morning Astronomical twilight is when the sun is between -18° and -12° below the horizon.
♠ Evening civil twilight begins at Sunset, when the sun is between 0° and -6° below the horizon
♠ Evening Nautical twilight is when the sun is between -6° and -12° below the horizon.
♠ Evening Astronomical twilight is when the sun is between -12° and -18° below the horizon.
♠ Click/Tap to see a
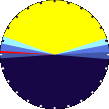
Twilight Degrees Image
The above solar/lunar tracking graphic displays the daily tracks of the sun & moon as they track over our sky in realtime. You must refresh your browser for latest realtime positions. The green dashed line is the track of the moon and the golden dashed line is the track of the sun. The highest track for the sun is on 'June 21st' (summer solstice) as shown on the graphic. The lowest track of the sun is on 'Dec 21st' (Winter Solstice) as seen on the graphic. The suns mid point in the sky (Vernal Equinox) is shown by the "Equinox" line and occurs twice per year (Spring and Autumn Equinox).
You can always see where the sun and moon are located in the world in 'degrees' by referring to "Sun El" & "Moon EL" (EL refers to elevation) data as it relates to our local position in the world. The number is positive when the sun or moon is up in our local sky, and negative when they are tracking below the horizon. In this way you can always see the location of the sun and moon in the world as it relates to our local Placerville, CA. location. The Zenith parameter refers to the time of day the sun is at its highest postition in the sky. 'Sun AZ' refers to the sun's azimuth. 'Illimination %' is the current illumination of the moon. The current phase of the moon is shown in the moon graphic.
There are 10 different background changes during a 24 hour period, dependent on what time it is, which shows the day and night screens, the sunrise/sunset screens and the 6 twilight screens civil, nautical & astronomical (morning & evening twilights) in their proper time periods.
|
|
What is Live Weather & How Does it Work:
Our wireless, solar powered [green energy], Davis Vantage Pro2 Plus outdoor weather station transmits weather data to an indoor weather control console which collects all of the weather data. The indoor weather control console is wired directly to the El Dorado Weather computer server. This control console transmits data directly to the server which then uploads the data via FTP to our on-line El Dorado Weather web server. The time it takes from the outdoor weather station to the web server is approximately 2 to 3 seconds. Although we can set it to update "this page" every 3 to 4 seconds, we usually set it to update about every 60 seconds to save on bandwidth.
When new weather data is received it updates the data on the above weather panel. You can visually see newly updated data on the weather panel when it briefly flashes the data in green for about two seconds and then returns back to normal with the updated value. Only the data being updated will flash to green. The time of day and or date will independently flash green whenever there is a data update with the new time and date of the latest updated values.
Our Location:
All of the weather data above is taken from our Placerville CA. location, at an elevation of 1709 feet. We are located near the top of a hill which faces towards the Southwest. This location often receives higher rainfall amounts when storms have more favorable orographics for the Sierra Nevada Mountains and its foothills.
|
Live Panel Footnotes with Location & Forecast Info
1 Rain season: July 1st to June 30th. We keep extraordinary precise measurements of our rainfall. All of our rainfall is backed up daily by two separate professional rain gauges that are THE standard in the weather industry. During the fall & early spring when the oak tree leaves fly in the fall or oak flowers in the spring, the main rain guage for our Davis VP Pro+ Weather Station can get plugged up with leaves, pollen & debris. We then carefully measure the rain in our backup gauges and adjust the rainfall totals accordingly. The clogging up is worse in the spring with the oak flowers/pollen than in the fall. So if you see the rainfall totals unexpectedly jump up, then it was most likely due to our manual rainfall adjustment.
2 When there is measurable rainfall for the day, 3 separate data fields appear, the average hourly rainfall rate (Rain Rate /hr), the average hourly rainfall rate high for the day (Rain Rate High /hr) and the total rainfall for the storm (Storm Rain). Otherwise precipitation for the last 7 days, the highest rainfall day on record & number of days since the last precipitation are used. Day record is the most rainfall amount on any 24 hour day at the station since 6/22/2006.).
3 Air Quality Index is provided by Minnesota Polution Control Agency and is updated hourly between the hours of 6AM and Midnight.
4 Solar Index represents either an absolute scale of solar energy (W/m²) using the station’s recorded maximum or a percentage of computed theoretical solar maximum using the station’s location and time of day. These indices differ most when the sun is low on the horizon. The current scale is shown, and will toggle if it or the icon is clicked.
5 Beaufort wind force number and Beaufort scale in text).
6 Estimated amount of water needed to replace the water used by plants and evaporation from the past week. (Negative numbers mean amount of water needed, positive numbers mean excess water is present).
Placerville Location & Forecast Information: This weather station is located at 1,703 ft, about about 2 miles from highway 50 and El Dorado Rd. We have been providing Placerville, CA with live online weather data since June of 2006. This is one of our original web pages from our birth back in 2006. This page has seen many upgrades over the years. We have grown steadily since then to around 100,000 weather related web pages to serve most cities and towns across the entire world.
Placerville has many different elevation changes which manifests itself in 11 different micro climates. Placerville spans elevations from near 1,600 feet up to near 2,600 feet. This is why we offer 4 different forecasts for Placerville in order to cover the different elevations and provide more accurate forecasts.
All of Placerville's 4 different forecast links are located right below the forecast icons on this web page. They are highlighted in yellow.
Data Measurement Information: As with many locations in the foothills, trees can be a factor in the mornings and later in the afternoon for measurements such as Wind, Solar & UV. Particularly in the cold season when the sun is low on the horizon. Our anemometer is 26 feet high, but still wind runs a few mph lower than normal in a couple directions where trees are present, which is accurately adjusted for. Our station data records go back to June 22, 2006, 9 years of Placerville data as of this writing. Normals & Records are based on downtown Placerville historic records dating back decades, not from this stations shorter term data. We do however use our own historic station data in many other instances.
|
|


